Position statement
Dietary intake of sodium by children: Why it matters

Posted: Jan 30, 2020 | Reaffirmed: Jan 12, 2026
Principal author(s)
Manjula Gowrishankar, Becky Blair, Michael J. Rieder, Canadian Paediatric Society, Nutrition and Gastroenterology Committee, Drug Therapy Committee
Paediatr Child Health 2020 25(1):47–53. 
Abstract
Dietary sodium is required in very small amounts to support circulating blood volume and blood pressure (BP). Available nutritional surveillance data suggest that most Canadian children consume sodium in excess of their dietary requirements. Approximately 80% of the sodium Canadians consume comes from processed and packaged foods. High sodium intakes in children may be an indicator of poor diet quality. Results from systematic reviews and meta-analyses have demonstrated that decreasing dietary sodium in children leads to small but clinically insignificant decreases in BP. However, population-level strategies to reduce sodium consumption, such as food product reformulation, modifying food procurement processes, and federal healthy eating policies, are important public health initiatives that can produce meaningful reductions in sodium consumption and help to prevent chronic disease in adulthood.
Keywords: Blood pressure; Children; Diet; Hypertension; Nutrition; Preventive health; Salt; Sodium
Sodium is an electrolyte that maintains extracellular fluid volume, thereby supporting effective circulating volume and blood pressure (BP) [1]. In infants and children, these essential physiological effects require only small amounts of dietary sodium. Paediatricians ensure that sufficient sodium is being provided for optimal growth in neonates.
Sodium is ubiquitous in the Canadian food supply and high amounts of sodium are common in processed and pre-packaged foods. It is well known that reducing dietary sodium reduces hypertension in adults [2]–[4]. However, the impacts of consuming a high sodium diet on risk for hypertension and other chronic diseases in healthy children are less clear. This statement describes the current evidence linking dietary sodium with adverse health outcomes in healthy children and provides recommendations for assessing and managing sodium intake and healthier eating.
SODIUM INTAKE GUIDELINES FOR HEALTHY INFANTS AND CHILDREN
Guidelines for sodium intakes have been established by both the National Academies of Sciences, Engineering and Medicine (NASEM) (formerly the Institute of Medicine) [1] and the World Health Organization (WHO) [5]. For infants aged 0 to 6 months old, the adequate intake (AI) for sodium is based on amounts found in breast milk. The AI for older infants (6 to 12 months) was determined by estimating the sodium content of breast milk and complementary foods. The NASEM committee believed that children aged 12 months have sufficient renal function to maintain sodium balance at these AI levels. The AI for children and youth aged 1 to 18 years was extrapolated from the adult AI of 1,500 mg/day, using average estimated energy requirements for different groups [6].
In 2019, the NASEM Committee to Review the Dietary Reference Intakes for Sodium and Potassium updated the definition of the tolerable upper level (UL). Previously, the UL was defined as “the highest level of nutrient intake that is likely to pose no adverse health effects for nearly all people in a particular group” [1]. To further define ‘adverse health effects’, the committee currently characterizes the UL as ‘toxicological risk’. They also developed a new term, the ‘chronic disease risk reduction’ (CDRR) intake for sodium, to describe the “intake above which intake reduction is expected to reduce chronic disease risk within an apparent healthy population” (Table 1) [4].
The WHO has recommended that children aged 2 to 15 years of age reduce their sodium intake to control BP [5] and that the maximum sodium intake level of 2,000 mg/day in adults be adjusted downward, based on the estimated energy requirements of children compared with adults. Overall, there is insufficient evidence to determine whether reducing mean sodium intakes to 2,300 mg per day [4] would more positively influence cardiovascular disease or all-cause mortality outcomes in the general adult population.
| Table 1. Sodium intake recommendations from the NASEM’s Committee to Review the Dietary Reference Intakes for Sodium and Potassium | |||
| Age | Adequate intake (mg/day) | Tolerable upper level (mg/day) | Chronic disease risk reduction intake (mg/day) |
| 0–6 months | 110 | Not determined | Not determined |
|
7–12 months |
370 |
Not determined |
Not determined |
| 1–3 years | 370 | Not determined | Reduce intake if above 1,200 |
| 4–8 years | 1,000 | Not determined | Reduce intake if above 1,500 |
| 9–13 years | 1,200 | Not determined | Reduce intake if above 1,800 |
| 14–70 years | 1,500 | Not determined | Reduce intake if above 2,300 |
| Data drawn from reference [4]. | |||
| NASEM National Academy of Sciences, Engineering and Medicine. | |||
HOW MUCH SODIUM ARE CANADIAN CHILDREN CONSUMING?
Despite these guidelines, sodium intakes in Canadian children are known to be high. The most recent sodium intake estimates in the Canadian population are derived from the 2015 Canadian Community Health Survey (CCHS) [6]. In this nationally representative sample, using the previous tolerable UL reference values for sodium [1], 49% of children 1 to 3 years old and 72% of children 4 to 8 years old were consuming sodium at levels exceeding age-specific CDRR intake thresholds. The average sodium intakes for these age groups were 1,530 mg/day (CDRR = 1,200 mg/d) and 2,160 mg/day (CDRR = 1,500 mg/d), respectively [6] (Figures 1 and 2). The CCHS did not assess sodium intake in infants. In the USA, infants 6 to 12 months of age consume an estimated 497 to 518 mg of sodium per day [7][8]. Also, because there is no recognized CDRR or UL for infants younger than 12 months [1], it is impossible to compare infant sodium intakes with guideline recommendations.
Most children aged 9 to 18 years consume sodium far above the CDRR intake [1] (79% of males and 63% of females 9 to 13 years old, and 92% of males and 50% of females 14 to 18 years old). These estimates are similar to those found in 2004 [9]. Bakery products, mixed dishes, processed meats, cheeses, and soups are the top five dietary sources of sodium. Boys tend to consume more sodium than girls because their overall caloric intakes are higher [6].
Historically, salt has been added to food for flavour, preservation, and to provide the chemical reaction needed for baking and other types of food preparation. Adding salt and other sodium-containing compounds (e.g., disodium phosphate) to processed foods can improve flavour or serve a functional role at low cost [10]. However, this practice can also be deceiving, in that some foods can contain large amounts of sodium without tasting salty [11]. For example, there is more sodium in a single-serving of O-shaped cereal (204 mg of sodium per 30 g/250 mL) than in a single-serving of dry-roasted salted peanuts (152 mg of sodium per 37 g/60 mL) [12][13]. For examples of how sodium levels increase with food processing, see Table 2.
‘Saltiness’ is a defining human taste [14]. At birth, human infants are either insensitive or indifferent to salty taste. The development of a preference for salt may begin in infancy. Dietary exposure to sodium in early life may contribute to a preference for a salty taste in the preschool years [15].
| Table 2. Comparison of sodium content in unprocessed (i.e., ‘natural’) versus processed foods | ||
| Food item | Description | Sodium content (mg/100 g) |
| Beef | Topside, roast, lean fat | 48 |
| Corned beef, canned | 950 | |
| Bran | Wheat | 28 |
| Bran flakes | 1,000 | |
| Chick-peas | Dried, boiled in unsalted water | 5 |
| Canned, re-heated, drained | 220 | |
| Crab | Boiled | 370 |
| Canned | 550 | |
| Cod | In batter, fried in blended oil | 100 |
| Fish fingers, fried in blended oil | 350 | |
| New potatoes | Raw, boiled in unsalted water | 9 |
| Canned, re-heated and drained | 250 | |
| Peanuts | Plain | 2 |
| Dry roasted | 790 | |
| Roasted and salted | 400 | |
| Peas | Raw, boiled in salt water | Trace |
| Canned, re-heated, drained | 250 | |
| French fries | Homemade, fried in blended oil | 12 |
| (French fries) Oven chips, frozen, baked | 53 | |
| Salmon | Raw, steamed | 110 |
| Canned | 570 | |
| Smoked | 1,880 | |
| Sweet corn | On-the-cob, whole, boiled in unsalted water | 1 |
| Kernels, canned, re-heated, drained | 270 | |
| Tuna | Raw | 47 |
| Canned in oil, drained | 290 | |
| Canned in brine, drained | 320 | |
| 2,300 mg sodium = 1 level teaspoon table salt. Table salt (g) = sodium (g) × 2.5. |
||
| Information drawn from reference [5]. | ||
HEALTH CONSEQUENCES OF EXCESS SODIUM—HYPERTENSION AND OBESITY
Salt sensitivity
BP response to dietary sodium is believed to vary widely among individuals. People who experience a large BP response to a change in sodium load are often termed ‘sodium sensitive’. Sodium sensitivity is more common in people with hypertension, of African-American heritage, in women, and in individuals with metabolic syndrome [16].
| Figure 1. Average dietary sodium intake in children, according to age group. |
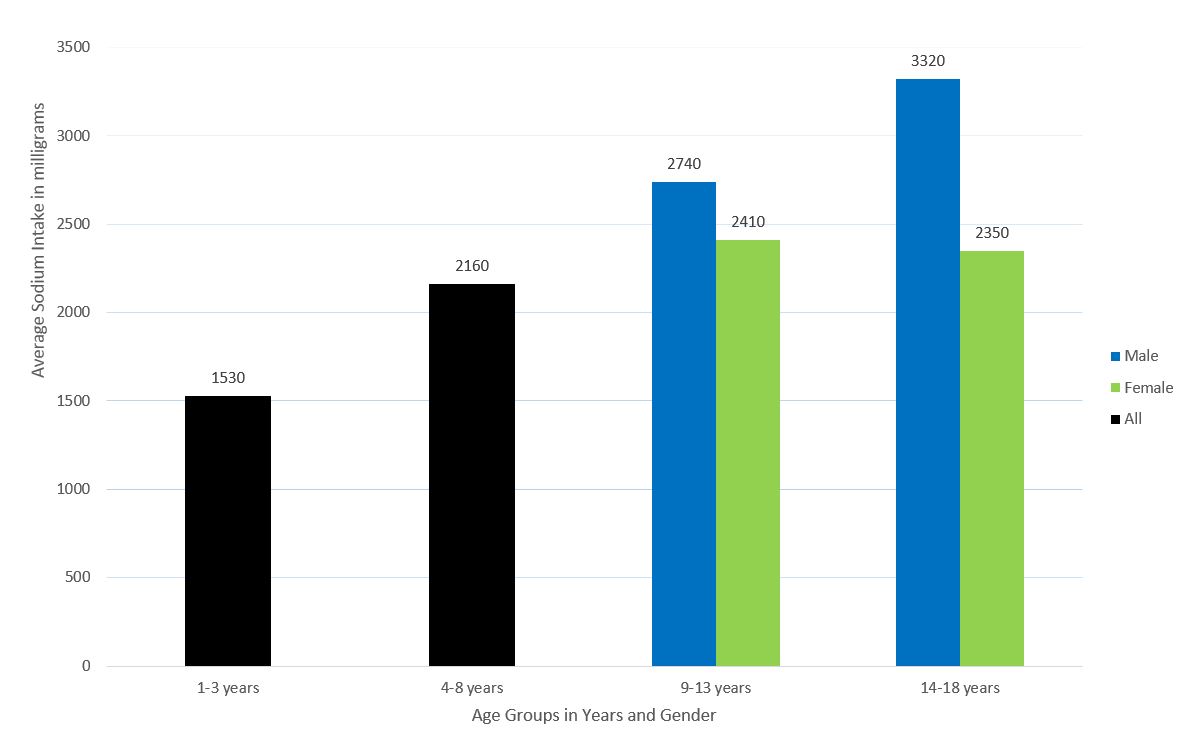 |
| Data drawn from reference [6] |
| Figure 2. Percentage of children in Canada consuming sodium above upper tolerable level (ULs), according to age group. |
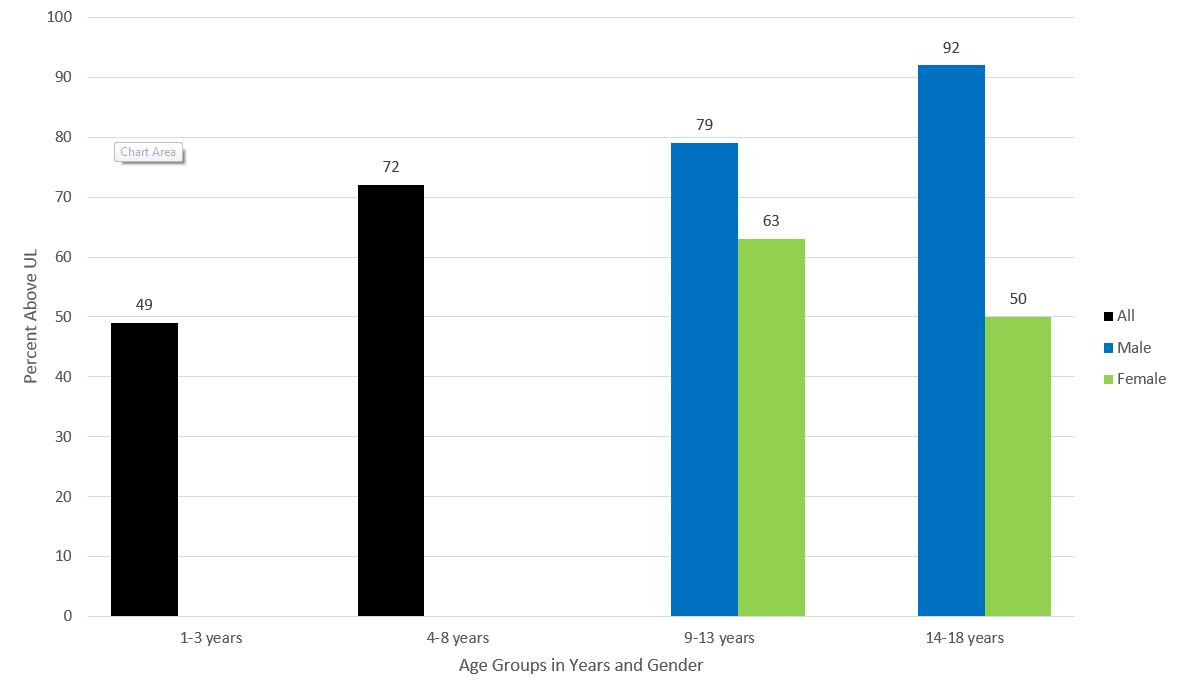 |
| Data drawn from reference [6] |
Children born with low birth weights (defined as <2,500 g by the WHO) may be at higher risk for developing hypertension if they consume excess sodium as they age. One study, which defined salt sensitivity as an increase in mean BP ≥3 mmHg over 24 hours while on a high salt diet, when compared with a controlled salt diet, found that children born with a low birth weight had a 37% increase in salt sensitivity. This response increased to 47% in children who were also small for gestational age (SGA) at birth, when they were measured at 11.3 ± 2.1 years of age [17].
The actual prevalence of sodium sensitivity in the Canadian population is unknown. The lack of standard definitions or practical, validated assessment methods has limited the ability to identify sodium sensitivity in clinical practice. However, even without a diagnostic test, demographic and clinical phenotypes associated with sodium-sensitive BP can be used to guide dietary advice [16].
Hypertension
Paediatric hypertension is defined as BP ≥95th percentile for age, sex, and height [18]. Recent Canadian data [19] suggest that 7% of children 6 to 17 years of age now have either borderline or overt hypertension.
Reduced dietary sodium is associated with small reductions in systolic BP in infants and children [2][20][21]. One systematic review [2][22] analyzed data from 9 randomized control trials (RCTs), using 14 comparisons, and found that decreases in dietary sodium reduced mean resting systolic BP by 0.84 mmHg (95% confidence interval [CI]: 1.43 to 0.25, moderate-quality evidence) and diastolic BP by 0.87 mmHg (95% CI: 1.6 to 0.14, low-quality evidence) in children 2 to 15 years of age. However, there was no effect of sodium on systolic or diastolic BP in children when non-randomized trial data were removed from the meta-analysis [2][22]. Another systematic review [3] found no significant differences in systolic or diastolic BP in children and youth aged 1 to 18 years who participated in short-term sodium reduction interventions. Removal of high or unclear risk for bias studies from the analysis revealed a small (0.80 mmHg) reduction in systolic BP (95% CI: 1.79 to 0.20, 8 RCTs, low-quality evidence) and a significant reduction in diastolic BP by 1.54 mmHg (95% CI: 2.57 to 0.51, 7 RCTs, low-quality evidence).
Some researchers maintain that the use of spot urine testing to assess individual sodium intake, when compared with multiple urine tests over 24 hours, could inaccurately estimate true intake by ± 3,000 mg among high-sodium consumers and potentially explain the non-significant results obtained in some trials [23].
Obesity
Emerging research suggests an association between high sodium intake and obesity in children [24]–[26]. Children who consume more sodium may also drink more sugar-sweetened beverages [27]–[29]. Higher sugar-sweetened beverage consumption has been speculated to lead to excess energy intake. In observational studies, an additional 1 gram per day (17 mmol/day) of sodium has been associated with a 23% to 28% [24][27] increased odds of having a BMI classified as overweight or obese.
The associations between sodium consumption and hypertension may be stronger among children and youth whose BMI indicates overweight or obesity [30]–[32]. Canadian surveillance data show that 31% of children and youth between the ages of 5 and 17 were either overweight or obese in 2015. Older children aged 12 to 17 years (34%) were more likely to be overweight or obese compared with children aged 5 to 11 years (27.6%) [33]. Although mechanisms to explain the association between sodium consumption and hypertension are unclear [3][34], they may well be mediated by overall diet quality. Specifically, high sodium intake may be a marker for poor quality diet overall, because children who consume foods that are high in sodium, such as processed foods, may also eat foods that are high in calories, sugar, and fat [34]–[37].
ARE THERE HEALTH RISKS ASSOCIATED WITH REDUCING DIETARY SODIUM?
Concerns have been raised that reducing sodium intake adversely affects insulin resistance, blood lipids, catecholamines, and cardiovascular disease risk factors [38]–[40]. However, such effects may be temporary or only seen in studies of lower methodological quality. Recent reviews examining trials in adults have concluded that evidence is insufficient to suggest there is harm in lowering sodium intake on measures of serum glucose, insulin resistance [3][5][41], and measures of blood lipid or catecholamines in interventions lasting at least 4 weeks [3]–[5].
INTERVENING TO LOWER SODIUM INTAKES
The Dietary Approach to Stop Hypertension (‘DASH’) sodium trial [42], showed a significant reduction in mean systolic BP (mean difference = −3.0 mmHg (95% CI: −1.7 to −4.30; P > 0.001)) in middle-aged, overweight adults who switched from a high-sodium diet (3,450 mg per day or 150 mmol per day) to a low-sodium diet (1,150 mg per day or 50 mmol per day). A similar trend was observed for diastolic BP [43]. Despite these encouraging findings, one systematic review concluded that adherence to the DASH diet may be suboptimal among adolescents [44]. It is plausible that adolescents are less concerned about the cardiovascular risks of hypertension than middle-aged adults.
Since modest reductions in sodium over the long term in adults have been found to improve BP without adverse effects on hormone or lipid levels [45], and because adherence to dietary interventions varies widely among individuals [44], population-level sodium reduction interventions to reduce BP have been recommended [46]. Indeed, population-level interventions may be more effective in reducing dietary sodium consumption than individual, behaviour-based interventions [47]–[49]. A recent Cochrane review [48] reported that multicomponent government-level interventions were best suited to reduce population-level sodium intakes. Food environment interventions, such as the reformulation of specific food products and improved food procurement processes, have yielded positive results by effectively decreasing sodium levels across the food supply chain. One systematic review has reported that added salt could be reduced by 40% in bread products and by 70% in processed meats without impacting consumer acceptance [50]. Sodium reductions on this scale within the food supply would ensure population-level impacts, because almost 80% of the sodium consumed in Canada comes from processed and prepackaged foods for household or food service use [51]. Only 11% of our sodium intake comes from salt added during cooking or to food at the table [51].
The Canadian government has initiated several policies to lower sodium consumption. In 2012, Health Canada published voluntary sodium reduction targets [52] and asked the food industry to reduce the amount of sodium in processed foods by 2016 [53]. A subsequent evaluation [54] revealed that only 14% of food categories had met their targets. Almost half of the food categories targeted showed no meaningful reductions in their sodium content and some were even higher in sodium in 2016 compared with 2012 levels.
There are no regulated maximum sodium limits for food products intended solely for children 1 to 4 years of age. However, as part of Canada’s Healthy Eating Strategy, Health Canada updated its Nutrition Labelling regulations in 2016 to include a requirement that a percent ‘daily value’ for sodium (using 1,500 mg/day as a reference amount) be added to Nutrition Facts tables on packaged foods intended solely for children in this youngest age group. On packaged foods intended for the general population, 2,300 mg/day is the reference amount used to calculate the percent daily value [55]. The food industry has until 2022 to apply these new labelling requirements [56]. Canada’s Food and Drug regulations currently limit the maximum amount of dietary sodium in infant formula (for babies 6 to 12 months old) to 60 mg/100 kcal [57].
Front-of-package regulations [58] in Canada will require that a specific label be displayed on packaged foods deemed to be high in sodium (as well as foods high in sugars or saturated fat), based on pre-determined thresholds. For most prepackaged foods, the proposed threshold is 15% of the daily value. Healthy Eating Strategy regulations will complement and reinforce Canada’s Food Guide, which recommends limiting intake of processed or prepared foods high in sodium. Restricting the marketing of foods and beverages to children and youth continues to be a promising policy initiative.
Because dietary preferences for salty foods and overall dietary habits are formed in childhood [59], it is logical that interventions to reduce sodium include the paediatric population. Canadian children who ingest high levels of dietary sodium may be consuming a poorer quality diet overall, putting them at risk for obesity and adult hypertension. Reducing the population-level consumption of processed foods high in sodium may be particularly impactful. Although reducing dietary sodium appears to have only small, clinically insignificant effects on BP response in individual children, lowering dietary sodium intake during childhood and adolescence remains an important public health initiative to prevent chronic disease in adulthood [2]. Paediatric health care providers must understand the concerns around high dietary sodium, counsel families to reduce intake levels and support government and public health strategies to reduce the high amount of dietary sodium Canadian families consume.
RECOMMENDATIONS
For public policy:
- Advocate and support government policies designed to reduce sodium consumption from processed foods, including:
- Setting mandatory sodium reduction targets for the food industry,
- Regulating the marketing of foods high in sodium to children and youth, and
- Requiring front-of-package labelling for foods high in sodium.
- Apply nutritional guidelines or standards, including sodium guidelines, available from regional or provincial health departments to:
- Procured and prepared food served to children in public institutions, such as childcare settings and hospitals, and
- Food available for sale or served in schools, especially in cafeterias and vending machines.
For paediatric practice:
- Assess each family’s dietary habits and educate parents, caregivers and youth on how to reduce their dietary sodium intake using:
- The recommended sodium intake ranges (Table 1) and the resources below
- The Nutrition Facts Table and the % Daily Value for sodium on pre-packaged food labels.
RECOMMENDED RESOURCES
- A salty situation: www.canada.ca/en/health-canada/services/publications/food-nutrition/infographic-saltysituation.html
- Using the Nutrition Facts Table: % Daily Value: www.canada.ca/content/dam/canada/health-canada/migration/healthy-canadians/alt/pdf/publications/eating-nutrition/label-etiquetage/fact-fiche-eng.pdf
- Focus on the Facts: How to use serving size and % daily value: www.canada.ca/en/health-canada/services/publications/food-nutrition/focus-facts-how-use-servingsize-daily-value.htmlwww.canada.ca/en/health-canada/services/publications/food-nutrition/how-use-servingsize-daily-value.html
- Sodium Sense: Know your Sodium Facts. www.dietitians.ca/Downloads/Public/sodium_adults_may2012.aspx
- Cut out the salt: www.unlockfood.ca/en/Articles/Heart-Health/Cut-out-the-Salt.aspx
Acknowledgements
The authors wish to thank Nikate Singh, Dr. Tanis Fenton PhD, RD, and Dr. JoAnne Arcand, PhD, RD for contributing their content expertise to this manuscript. This position statement has been reviewed by the Community Paediatrics Committee of the Canadian Paediatric Society.
CANADIAN PAEDIATRIC SOCIETY NUTRITION AND GASTROENTEROLOGY COMMITTEE
Members: Dana L. Boctor MD (past member), Linda M. Casey MD, Jeffrey N. Critch MD (past Chair), Manjula Gowrishankar MD (past member), Eddy Lau MD (Board Representative), Catherine M. Pound MD (Chair), Ana M. Sant’Anna MD, Pushpa Sathya MD, Christopher Tomlinson MB, ChB, PhD, Sharon L. Unger MD (past member)
Liaisons: Becky Blair MSc RD, Dietitians of Canada; Patricia D’Onghia MPH RD, Health Canada; Tanis R. Fenton PHD RD, Dietitians of Canada; Laura Haiek, Breastfeeding Committee for Canada; Deborah Hayward, Bureau of Nutritional Sciences, Sarah Lawrence MD, Canadian Pediatric Endocrine Group; Sarah Jane Schwarzenberg MD, Committee on Nutrition, American Academy of Pediatrics
CANADIAN PAEDIATRIC SOCIETY DRUG THERAPY AND HAZARDOUS SUBSTANCES COMMITTEE
Members: Francois Boucher MD (past Board Representative), Yaron Findelstein MD, Shinya Ito, Geert ‘t Jong MD (Chair), Shahrad Rassekh MD, Jean-François Turcotte MD (Board Representative), Sunita Vohra MD
Liaison: Michael J. Rieder MD PhD, Canadian Society of Pharmacology and Therapeutics
Principal authors: Manjula Gowrishankar MD, Becky Blair MSc RD, Michael J. Rieder MD PhD
References
- National Academies of Science, Engineering, Medicine, Institute of Medicine, Food and Nutrition Board. Sodium and chloride. In: Dietary Reference Intakes for Water, Potassium, Sodium, Chloride, and Sulfate. Washington, DC: National Academies Press, 2005. www.nap.edu/catalog/10925/dietary-reference-intakes-for-waterpotassium-sodium-chloride-and-sulfate (Accessed October 23, 2018).
- Aburto NJ, Ziolkovska A, Hooper L, Elliott P, Cappuccio FP, Meerpohl JJ. Effect of lower sodium intake on health: Systematic review and meta-analyses. BMJ 2013;346:f1326.
- Newberry SL, Chung M, Anderson CAM, et al. Sodium and Potassium Intake: Effects on Chronic Disease Outcomes and Risks. Comparative Effectiveness Review No. 206. AHRQ Publication No. 18-EHC009-EF. Rockville, MD: Agency for Healthcare Research and Quality, 2018.
- National Academies of Sciences, Engineering, Medicine. Dietary Reference Intakes for Sodium and Potassium, March 2019. www.nationalacademies.org/hmd/Reports/2019/dietary-reference-intakes-sodium-potassium.aspx (Accessed July 10, 2019).
- World Health Organization. Guideline: Sodium Intake for Adults and Children. Geneva, Switzerland: WHO, 2012. www.who.int/nutrition/publications/guidelines/sodium_intake_printversion.pdf (Accessed October 23, 2018).
- Government of Canada, Health Canada. Sodium Intake of Canadians in 2017. www. canada.ca/en/health-canada/services/publications/food-nutrition/sodium-intakecanadians-2017.html (Accessed October 23, 2018).
- Maalouf J, Cogswell ME, Yuan K, et al. Top sources of dietary sodium from birth to age 24 mo, United States, 2003-2010. Am J Clin Nutr 2015;101(5):1021–8.
- Ahluwalia N, Herrick KA, Rossen LM, et al. Usual nutrient intakes of US infants and toddlers generally meet or exceed Dietary Reference Intakes: Findings from NHANES 2009-2012. Am J Clin Nutr 2016;104(4):1167–74.
- Garriguet D. Sodium consumption at all ages. Health Rep 2007;18(2):47–52.
- Institute of Medicine (US) Committee on Strategies to Reduce Sodium Intake. Preservation and physical property roles of sodium in foods. In: Henney JE, Taylor CL, Boon CS, eds. Strategies to Reduce Sodium Intake in the United States. Washington, DC: National Academies Press, 2010. www.ncbi.nlm.nih.gov/books/NBK50952 (Accessed October 23, 2018).
- Scourboutakos MJ, Murphy SA, L’Abbe MR. Association between salt substitutes/enhancers and changes in sodium levels in fast-food restaurants: A cross-sectional analysis. CMAJ Open 2018;6(1):E118–25.
- Canadian Nutrient File. Cereal, ready to eat, Cheerios, General Mills. Food code 1475. 2016. https://nutritiondata.self.com/facts/breakfast-cereals/1522/2 (Accessed October 23, 2018).
- Canadian Nutrient File. Peanuts, all types, dry-roasted, salted. Food code 3302. 2016. https://nutritiondata.self.com/facts/legumes-and-legume-products/4358/2 (Accessed October 23, 2018).
- Mennella JA, Finkbeiner S, Lipchock SV, Hwang LD, Reed DR. Preferences for salty and sweet tastes are elevated and related to each other during childhood. PLoS One 2014;9(3):e92201.
- Stein LJ, Cowart BJ, Beauchamp GK. The development of salty taste acceptance is related to dietary experience in human infants: A prospective study. Am J Clin Nutr 2012;95(1):123–9.
- Elijovich F, Weinberger MH, Anderson CA, et al.; American Heart Association Professional and Public Education Committee of the Council on Hypertension; Council on Functional Genomics and Translational Biology; and Stroke Council. Salt sensitivity of blood pressure: A scientific statement from the American Heart Association. Hypertension 2016;68(3):e7–e46.
- Simonetti GD, Raio L, Surbek D, Nelle M, Frey FJ, Mohaupt MG. Salt sensitivity of children with low birth weight. Hypertension 2008;52(4):625–30.
- Dionne JM, Harris KC, Benoit G, et al.; Hypertension Canada Guideline Committee. Hypertension Canada’s 2017 guidelines for the diagnosis, assessment, prevention, and treatment of pediatric hypertension. Can J Cardiol 2017;33(5):577–85.
- Statistics Canada. Health Fact Sheets. Blood Pressure of Children and Youth, 2012–2015. www150.statcan.gc.ca/n1/pub/82-625-x/2016001/article/14659-eng.htm (Accessed October 23, 2018).
- He FJ, MacGregor GA. Importance of salt in determining blood pressure in children: Meta-analysis of controlled trials. Hypertension 2006;48(5):861–9.
- Leyvraz M, Chatelan A, da Costa BR, et al. Sodium intake and blood pressure in children and adolescents: A systematic review and meta-analysis of experimental and observational studies. Int J Epidemiol 2018;47(6):1796–810.
- World Health Organization. Effect of Reduced Sodium Intake on Blood Pressure and Potential Adverse Effects in Children. Geneva, Switzerland: WHO, 2012.
- Cogswell ME, Mugavero K, Bowman BA, Frieden TR. Dietary sodium and cardiovascular disease risk–Measurement matters. N Engl J Med 2016;375(6):580–6.
- Ma Y, He FJ, MacGregor GA. High salt intake: Independent risk factor for obesity? Hypertension 2015;66(4):843–9.
- Grimes CA, Riddell LJ, Campbell KJ, He FJ, Nowson CA. 24-h urinary sodium excretion is associated with obesity in a cross-sectional sample of Australian schoolchildren. Br J Nutr 2016;115(6):1071–9.
- Lee SK, Kim MK. Relationship of sodium intake with obesity among Korean children and adolescents: Korea National Health and Nutrition Examination Survey. Br J Nutr 2016;115(5):834–41.
- Grimes CA, Wright JD, Liu K, Nowson CA, Loria CM. Dietary sodium intake is associated with total fluid and sugar-sweetened beverage consumption in US children and adolescents aged 2-18 y: NHANES 2005-2008. Am J Clin Nutr 2013;98(1):189–96.
- Grimes CA, Riddell LJ, Campbell KJ, Nowson CA. Dietary salt intake, sugarsweetened beverage consumption, and obesity risk. Pediatrics 2013;131(1):14–21.
- He FJ, Marrero NM, MacGregor GA. Salt intake is related to soft drink consumption in children and adolescents: A link to obesity? Hypertension 2008;51(3):629–34.
- Friedemann C, Heneghan C, Mahtani K, Thompson M, Perera R, Ward AM. Cardiovascular disease risk in healthy children and its association with body mass index: Systematic review and meta-analysis. BMJ 2012;345:e4759.
- Shi Y, de Groh M, Morrison H. Increasing blood pressure and its associated factors in Canadian children and adolescents from the Canadian Health Measures Survey. BMC Public Health 2012;12:388.
- Yang Q, Zhang Z, Kuklina EV, et al. Sodium intake and blood pressure among US children and adolescents. Pediatrics 2012;130(4):611–9.
- Statistics Canada. Table 13-10-0795-01. Formerly CANSIM Table 105–2024. Measured children and youth body mass index (BMI) (World Health Organization classification), by age group and sex, Canada and provinces, Canadian Community Health Survey-Nutrition. www150.statcan.gc.ca/t1/tbl1/en/tv.action?pid=1310079501 (Accessed October 23, 2018).
- Wirix AJ, Kaspers PJ, Nauta J, Chinapaw MJ, Kist-van Holthe JE. Pathophysiology of hypertension in obese children: A systematic review. Obes Rev 2015;16(10):831–42.
- Poti JM, Mendez MA, Ng SW, Popkin BM. Is the degree of food processing and convenience linked with the nutritional quality of foods purchased by US households? Am J Clin Nutr 2015;101(6):1251–62.
- Moubarac JC, Martins AP, Claro RM, Levy RB, Cannon G, Monteiro CA. Consumption of ultra-processed foods and likely impact on human health. Evidence from Canada. Public Health Nutr 2013;16(12):2240–8.
- Drewnowski A, Maillot M, Rehm C. Reducing the sodium-potassium ratio in the US diet: A challenge for public health. Am J Clin Nutr 2012;96(2):439–44.
- Graudal NA, Galloe AM, Garred P. Effects of sodium restriction on blood pressure, renin, aldosterone, catecholamines, cholesterols, and triglyceride: A meta-analysis. JAMA 1998;279(17):1383–91.
- Strazzullo P, D’Elia L, Kandala NB, Cappuccio FP. Salt intake, stroke, and cardiovascular disease: Meta-analysis of prospective studies. BMJ 2009;339:b4567.
- Graudal NA, Hubeck-Graudal T, Jurgens G. Effects of low sodium diet versus high sodium diet on blood pressure, renin, aldosterone, catecholamines, cholesterol, and triglyceride. Cochrane Database Syst Rev 2017;4:CD004022.
- Patel SM, Cobb P, Saydah S, Zhang X, de Jesus JM, Cogswell ME. Dietary sodium reduction does not affect circulating glucose concentrations in fasting children or adults: Findings from a systematic review and meta-analysis. J Nutr 2015;145(3):505–13.
- Appel LJ, Moore TJ, Obarzanek E, et al. A clinical trial of the effects of dietary patterns on blood pressure. DASH Collaborative Research Group. N Engl J Med 1997;336(16):1117–24.
- Sacks FM, Svetkey LP, Vollmer WM, et al.; DASH-Sodium Collaborative Research Group. Effects on blood pressure of reduced dietary sodium and the Dietary Approaches to Stop Hypertension (DASH) diet. DASH-Sodium Collaborative Research Group. N Engl J Med 2001;344(1):3–10.
- Kwan MW, Wong MC, Wang HH, et al. Compliance with the Dietary Approaches to Stop Hypertension (DASH) diet: A systematic review. PLoS One 2013;8(10):e78412.
- He FJ, Li J, Macgregor GA. Effect of longer-term modest salt reduction on blood pressure. Cochrane Database Syst Rev 2013;(4):CD004937.
- World Health Organization. SHAKE the Salt Habit: The SHAKE Technical Package for Salt Reduction. Geneva: WHO, 2016. http://apps.who.int/iris/bitstream/handle/10665/250135/9789241511346-eng.pdf;jsessionid=591A02BC112A91DD6EA0FC644277170F?sequence=1 (Accessed October 31, 2018).
- Santos JA, Trieu K, Raj TS, et al. The science of salt: A regularly updated systematic review of the implementation of salt reduction interventions (March-August 2016). J Clin Hypertens (Greenwich) 2017;19(4):439–51.
- McLaren L, Sumar N, Barberio AM, et al. Population-level interventions in government jurisdictions for dietary sodium reduction. Cochrane Database Syst Rev 2016;9:CD010166.
- Hyseni L, Elliot-Green A, Lloyd-Williams F, et al. Systematic review of dietary salt reduction policies: Evidence for an effectiveness hierarchy? PLoS One 2017;12(5):e0177535.
- Jaenke R, Barzi F, McMahon E, Webster J, Brimblecombe J. Consumer acceptance of reformulated food products: A systematic review and meta-analysis of salt-reduced foods. Crit Rev Food Sci Nutr 2017;57(16):3357–72.
- Mattes RD, Donnelly D. Relative contributions of dietary sodium sources. J Am Coll Nutr 1991;10(4):383–93.
- Government of Canada, Health Canada. Guidance for the Food Industry on Reducing Sodium in Processed Foods –Summary Table. 2012. www.canada.ca/en/health-canada/services/food-nutrition/legislation-guidelines/guidancedocuments/summary-table-guidance-food-industry-reducing-sodium-processedfoods-2012.html (Accessed October 23, 2018).
- Government of Canada, Health Canada. Guidance for the Food Industry on Reducing Sodium in Processed Foods. 2012. www.canada.ca/en/health-canada/services/food-nutrition/legislation-guidelines/guidance-documents/guidance-food-industryreducing-sodium-processed-foods-2012.html (Accessed October 23, 2018).
- Government of Canada, Health Canada. Sodium Reduction in Processed Foods in Canada: An Evaluation of Progress toward Voluntary Targets from 2012 to 2016. www.canada.ca/en/health-canada/services/food-nutrition/legislation-guidelines/guidance-documents/guidance-food-industry-reducing-sodium-processed-foodsprogress-report-2017.html (Accessed October 23, 2018).
- Government of Canada. Nutrition Labelling – Table of Daily Values. 2016. www.canada.ca/en/health-canada/services/technical-documents-labellingrequirements/table-daily-values/nutrition-labelling.html (Accessed October 23, 2018).
- Government of Canada. Regulations and Compliance – Nutrition Labelling. 2018. www.canada.ca/en/health-canada/services/food-nutrition/food-labelling/nutrition-labelling/regulations-compliance.html (Accessed October 23, 2018).
- Government of Canada, Justice Laws Website. Part B: Foods (continued). Division 25 (continued). Human milk Substitutes and Foods Containing Human Milk Substitutes. http://laws-lois.justice.gc.ca/eng/regulations/c.r.c.,_c._870/page-86.html (Accessed October 23, 2018).
- Government of Canada. Toward Front-of-Package Nutrition Labels for Canadians.2016. www.canada.ca/en/health-canada/programs/front-of-package-nutritionlabelling/consultation-document.html (Accessed October 23, 2018).
- Mura Paroche M, Caton SJ, Vereijken CMJL, Weenen H, Houston-Price C. How infants and young children learn about food: A systematic review. Front Psychol 2017;8:1046.
Disclaimer: The recommendations in this position statement do not indicate an exclusive course of treatment or procedure to be followed. Variations, taking into account individual circumstances, may be appropriate. Internet addresses are current at time of publication.